

In December 2015 at the Paris Agreement, Oxfam presented their paper on Extreme Carbon Inequality. As one can see in the graph below in G20 countries for which they had data, the per capita GHG emissions for the richest top 10% of households in every country were well above average. Whereas on the flip side, the bottom 50% and bottom 40% of households’ GHG emissions were below average. This explains why the carbon pricing program of climate income where we have data (USA, Australia, and Canada) on average at least ⅔ of households come out ahead. Most countries have similar income distributions. You can use Wolfram Alpha to determine your country’s income distribution pattern and Gini Index relative to Australia, Canada, and the USA and then infer that the results would be anticipated to be similar. 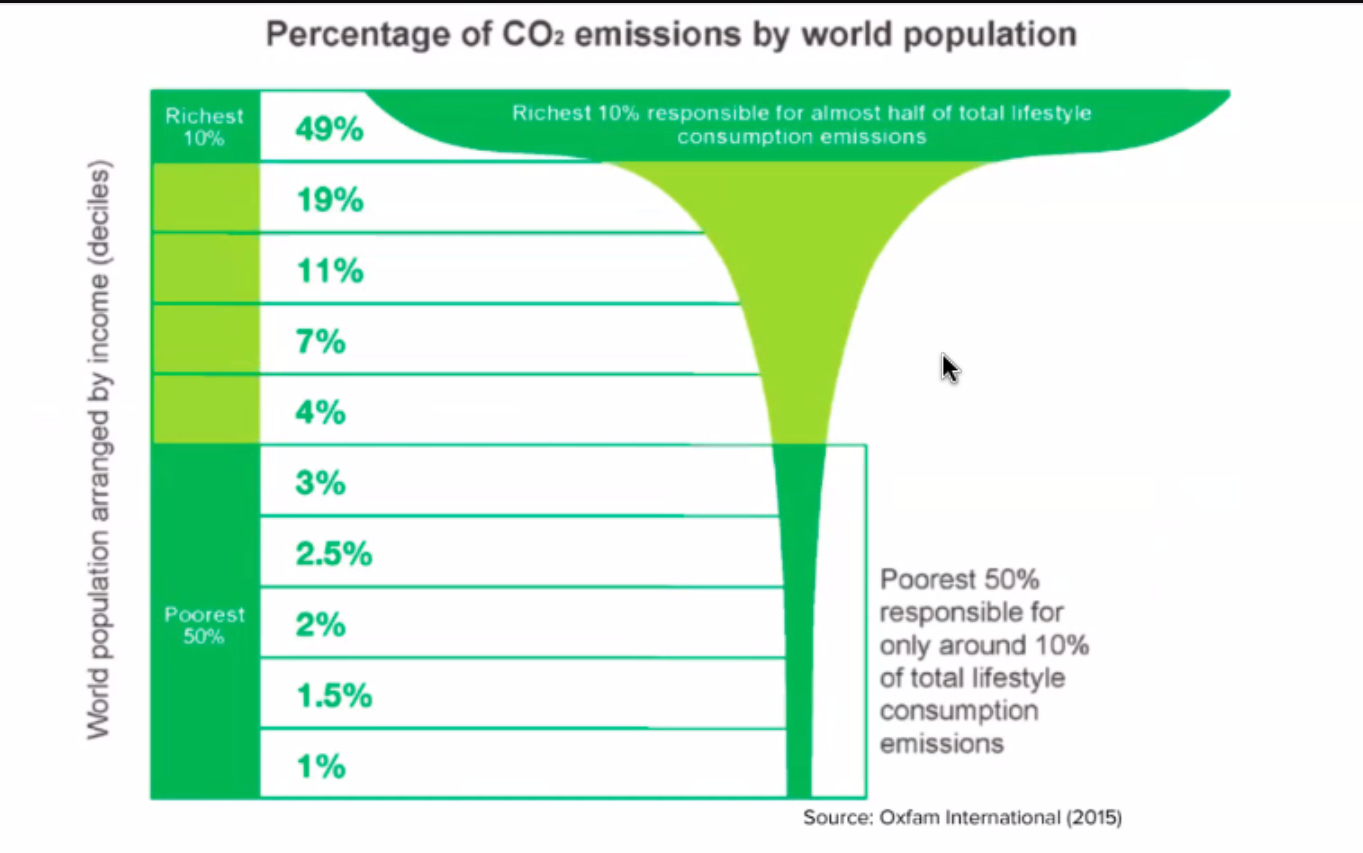
Carbon Inequality in the G20 Nations


FOLLOW AND JOIN US
 |
 |
 |
 |
 |
 |
Annual National Planning Sessions
Jan 2026: Standing Our Ground V
Jan 2025: Standing Our Ground IV
Jan 2024: Standing Our Ground III
Jan 2023: Standing Our Ground II
Jan 2022: Standing Our Ground I
RESOURCES
Laser Talks Page
Monthly Actions
LAND ACKNOWLEDGEMENT
CCL Canada respectfully acknowledges that the work we support stretches across the homes of many First Nations, Métis and Inuit peoples on Turtle Island and that their traditional knowledge must be significantly incorporated as part of meaningful action on the climate crisis. We acknowledge that they are traditional owners and custodians of this land and that for decades they have been the first line of defence against climate breakdown. Indigenous resistance has stopped at least 1.8 billion metric tonnes of greenhouse gas pollution on Turtle Island