

NEWS: By the Numbers – Canada’s GHG Targets are Inadequate
April 19, 2016
Canada will officially sign the Paris Agreement this week.
Note well that our GHG emissions are currently increasing and our targets are inadequate.
The numbers quoted in this post are about as close to factual as one can get.

CANADA’S EMISSIONS ROSE IN 2014 Canada’s total GHG emissions were estimated to be 732 megatonnes of carbon dioxide equivalent (Mt CO2 eqFootnote 2), excluding Land Use, Land-Use Change and Forestry (LULUCF) estimates. https://www.ec.gc.ca/ges-ghg/default.asp?lang=En&n=662F9C56-1

Although Canada represented approximately 1.6% of total global GHG emissions in 2012 (CAIT 2015), it is one of the highest per capita emitters. In 1990, Canadians released 22.1 tonnes (t) of GHGs per capita. In 2000, this indicator had risen to 24.3 t; however, by 2009, it had dropped to 20.7 t and has remained at historic lows ever since https://www.ec.gc.ca/ges-ghg/default.asp?lang=En&n=662F9C56-1
In 2014, CO2 accounted for 78% of Canada’s total emissions (Figure S-2). The majority of these emissions result from the combustion of fossil fuels. CH4 accounted for 15% of Canada’s total emissions, largely from fugitive emissions from oil and natural gas systems, as well as domestic livestock and landfills. N2O emissions, largely from agricultural soil management and transportation, accounted for 5% of emissions. Emissions of the synthetic gases (HFCs, PFCs, SF6 and NF3) constituted the remainder (slightly more than 1%). https://www.ec.gc.ca/ges-ghg/default.asp?lang=En&n=662F9C56-1
For the purposes of analyzing economic trends and policies, it is useful to allocate emissions to the economic sector from which the emissions originate. These emissions are presented in Figure S-8 and Table S-3. In general, a comprehensive emission profile for a specific economic sector is developed by reallocating the relevant proportion of emissions from various IPCC subcategories. This reallocation simply re-categorizes emissions under different headings and does not change the overall magnitude of Canadian emissions estimates. https://www.ec.gc.ca/ges-ghg/default.asp?lang=En&n=662F9C56-1
Emissions vary significantly by province, due to factors such as population, energy sources and economic structure. All else being equal, economies based on resource extraction will tend to have higher emission levels than service-based economies. Likewise, provinces that rely on fossil fuels for their electricity generation will have higher emissions than those that rely more on hydroelectricity. Historically, Alberta has been one of the highest emitting province; its emissions increased from 233 Mt in 2005 to 274 Mt in 2014 (17%), primarily due to the expansion of oil and gas operations (Figure S-9 and Table S-4). In contrast, Ontario’s emissions have steadily decreased since 2005 (by 40 Mt or 19%), primarily due to the closure of coal-fired electricity generation plants. Quebec and British Columbia, which rely on abundant hydroelectric resources for their electricity production, show more stable emission patterns across the time series and a decreasing pattern since 2005. Quebec experienced a 7.8% (7.0 Mt) decrease from its 2005 emissions level, while British Columbia had a decline of 3.4% (2.2 Mt). Emissions in Nova Scotia, New Brunswick and Prince Edward Island have also decreased since 2005, especially in Nova Scotia (29% reduction). Emissions in Saskatchewan increased by 8.6% (6.0 Mt) between 2005 and 2014, as a result of activities in the oil and gas industry as well as potash and uranium mining. Emissions in Manitoba and Newfoundland and Labrador have also increased since 2005 but to a lesser extent. https://www.ec.gc.ca/ges-ghg/default.asp?lang=En&n=662F9C56-1
Which category would you like for Canada to be rated under? The Climate Action Tracker (CAT) is an independent scientific analysis produced by four research organisations tracking climate action and global efforts towards the globally agreed aim of holding warming below 2°C, since 2009. The CAT Consortium include: Climate Analytics, Ecofys, NewClimate Institute and the Potsdam Institute for Climate Impact Research http://climateactiontracker.org/countries/canada
CANADA’S GHG’S ARE INADEQUATE http://climateactiontracker.org/countries/canada
Related Articles
-

Laser Talk: Our Rights and Liveable World
-
MEDIA RELEASE: The Climate Legacy of Justin Trudeau: A Perspective from Citizens’ Climate Lobby Canada
-
Laser Talk: World Meteorological Organization’s State of the Global Climate, Earth Day 2023
-
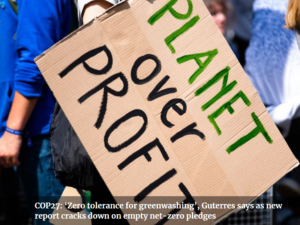
Laser Talk: UN’s Integrity Matters and High-Level Expert Group on Net-Zero Commitments


