

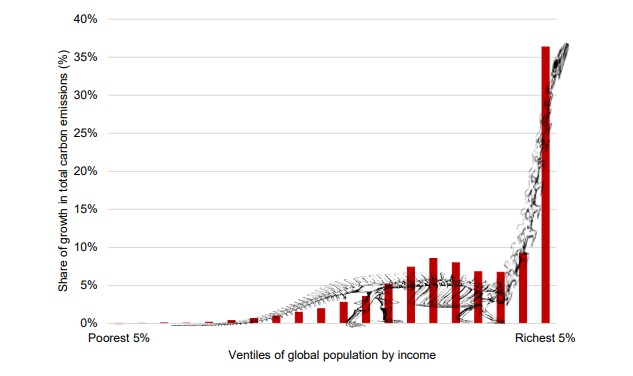
In September 2020, the Stockholm Environment Institute released an insightful report (1). In the 25 years from 1990 to 2015, annual global carbon emissions grew by 60%, approximately doubling total global cumulative emissions. The disproportionate impact of the world’s richest people is unmistakeable and the chart looks like a brontosaurus – with a tall neck and long tail. The “tall neck” is the result of the fact that nearly half of the total growth in absolute emissions was due to the richest 10%, with the richest 5% alone contributing over a third (37%). The emissions linked to the top 1% alone grew more than three times as much as those linked to the bottom 50%. The bottom 50% comprises the “long tail”. Since the bottom 50% has 50 times more people in it, the average per capita consumption emissions linked to the top 1% in 2015 were over 100 times greater than the average per capita consumption emissions of the poorest half of the world’s population. The global carbon budget is a precious natural resource. These results suggest a need for increased attention to be paid to the ongoing porcine impact of the small minority of the world’s richest citizens and the enormous and continuing economic development needs of the world’s poorest citizens. Our socio-economic and climate policies most certainly can be designed to address carbon inequality. In fact, Canada’s national backstop carbon pricing policy addresses the “brontosaurus in the room” (2). Data from Canada’s Parliament Budget Office confirms this assertion (3). Canada’s carbon pricing policy is a form of carbon fee and dividend. It is also known as climate income. Canada has put a revenue-neutral price on GHG pollution at the source, and gives 90% of the money back to the people equitably, regardless of income or carbon footprint. The other 10% of carbon fees collected go to the MUSH sector: Municipalities, Universities, Schools, and Hospitals. It also reduces GHGs (4) without creating burdensome tax policies for governments to administer. References: LASER TALK: The Carbon Inequality Brontosaurus Chart
(1) The Carbon Inequality Era | SEI (2020)
(2) The Greenhouse Gas Pollution Pricing Act (2018)
(3) Fiscal and Distributional Analysis of the Federal Carbon Pricing System (2019)
(4) Beyond Paris: Reducing Canada’s GHG Emissions by 2030 (2021)
LASER TALK: The Carbon Inequality Brontosaurus Chart
Home » CCL Canada News » LASER TALK: The Carbon Inequality Brontosaurus Chart


